Lucid IVE
Compiling with Lucid
Lucid is designed to work with C++ source code that you have written. Since modern development environments already include extensive tools to help you write and compile C++ code, your first step when working with any project is to use your favorite C++ IDE to write and compile your code.
To import your source code into Lucid, select either Open File or Open Project from the File menu in Lucid. If you are working with a project that consists of just a single source code file you should use Open File. For all projects consisting of more than one source code file you should use Open Project. When you select this option you will be prompted to select a folder on your computer: Lucid will load all of the C++ source code and header files from this folder.
Once your project is loaded you should see something like this in the main window.
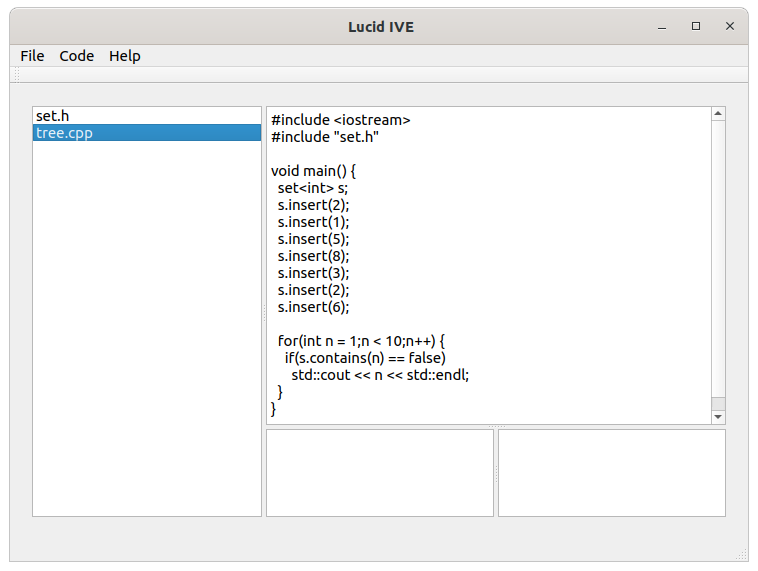
The pane on the left hand side of the window will display a list of all of the files in your project. You can click on any of the files listed there to load that file into the editor pane, which appears on the top right side of the window.
After loading your project into Lucid you should compile the project in Lucid by selecting Compile from the Code menu. Please note that the C++ emulator in Lucid does not support all of the features of the C++ language, so not all valid C++ code will compile successfully in Lucid.
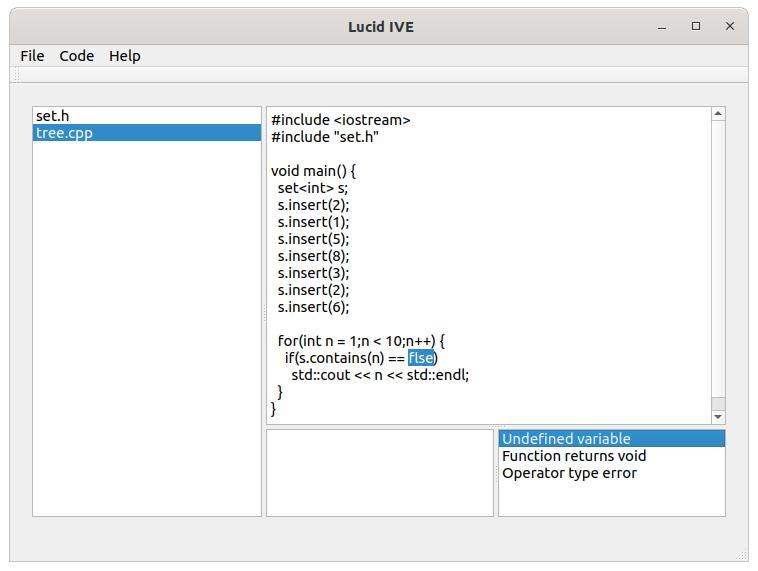
If your code contains errors, you will see a list of one or more error messages in the pane in the lower right hand corner of the main window. You can click on any of these error messages to highlight the location of the error in the editor pane.
If you have made any changes in the editor to fix your code, you can save your changes by selecting Save from the File menu.
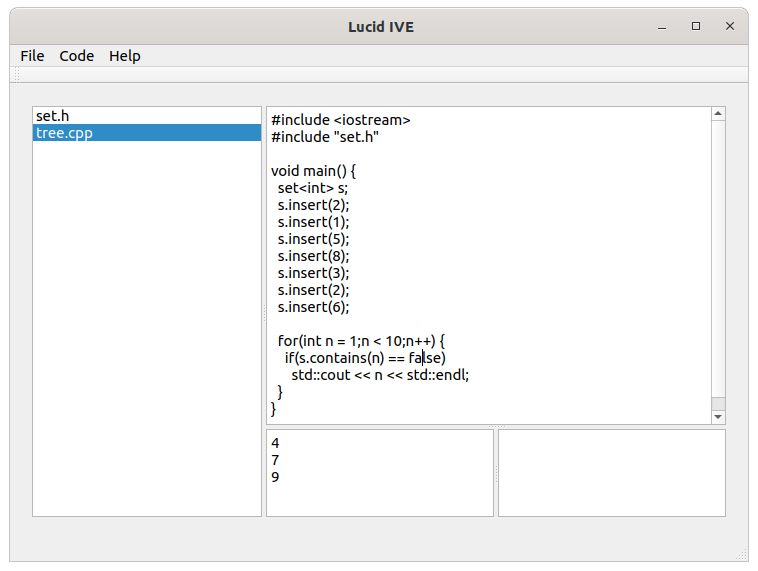
Once you have compiled your code successfully you can run your program by selecting
Run from the Code menu. If your program produces any
output through cout, that text output will appear in the pane in the
center of the bottom half of the window.
Debugging with Lucid
Once you have successfully compiled a project in Lucid you can use the debugging and visualization tools. The first step is to run your project in debug mode by selecting Debug from the Code menu. This will cause the main window in Lucid to switch to debug mode.
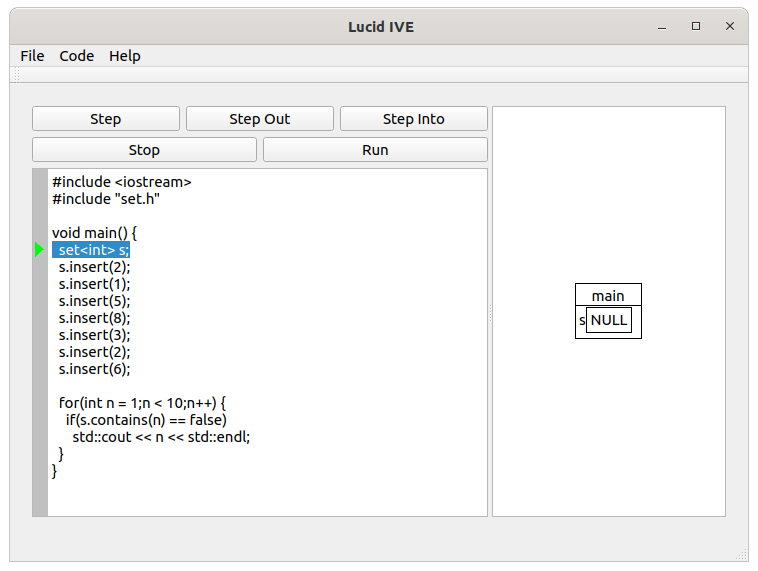
The debugger in Lucid functions in much the same way as debuggers in C++ IDEs. Using the buttons in the top left you can step through your code one step at a time, step into function calls and loops, and step out of functions or loops.
You can place a breakpoint by clicking in the gray margin to the left of your code. Clicking the Run button with a breakpoint set will cause the program to run until it hits that breakpoint.
Visualization with Lucid
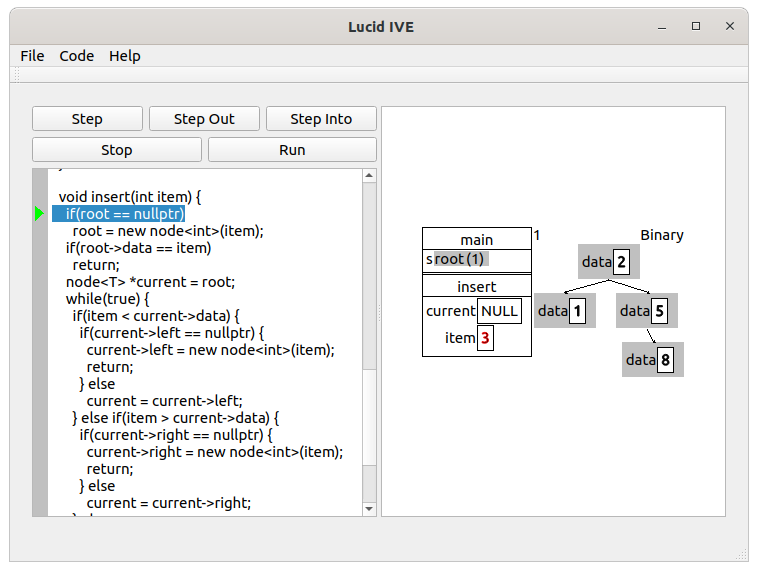
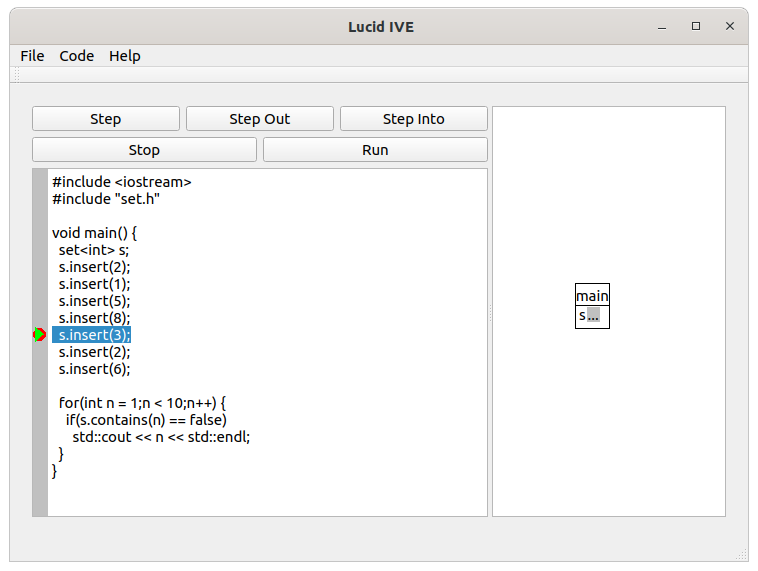
The right hand pane in debug mode displays visualizations of the data in your program. The first thing you will always see on the left hand side of the visualization pane is a visualization of your program's call stack. For example, if you step into a function in the debugger, you will see an entry for both your function's main function and for the function you stepped into in the call stack.
Each cell of the call stack displays all of the variables in each function in the
call stack. By default, larger items such as objects and arrays are shown in condensed form.
For example, in the picture above the main function contains a variable s
that contains an object. By default that object is not displayed, instead the call stack shows
an ellipsis, ..., next to the variable. To expand
the display for the object, simply double-click on the ellipsis.

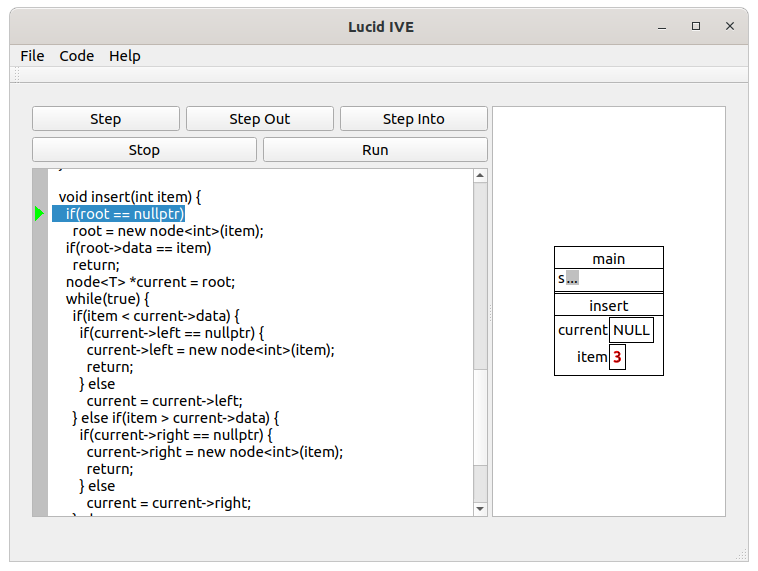
The expanded view shows that the object stored in s has a single member
variable, root, containing a pointer.
To view the object that the pointer points to, double click on the -> next to the member variable.
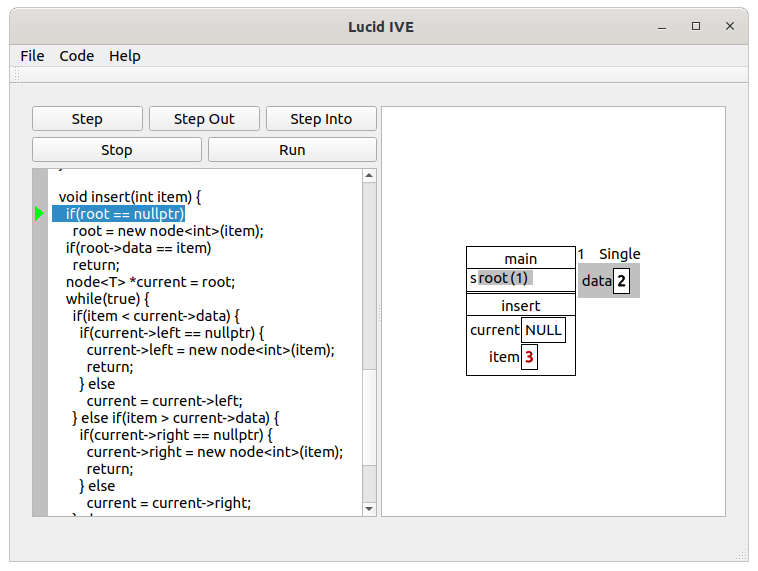
Double-clicking on the arrow causes the object that the pointer points to to appear in the space to the right of the call stack. Also, the -> changes to a numerical indicator, (1), that corresponds to the display number that appears just above the object.
When you first display an object, you will see that object displayed in single object mode. In this example, the object we have expanded is a root node in a binary tree. To see all of the other nodes that this object is linked to, double-click the word Single that appears just above the object. You will be prompted to select a display mode. In this case we will switch to the Tree display mode. Next, you will be prompted to specify which member variables in the object contain pointers to the left and right children of the node. After specifying this information, you will see the visualization display change to a full tree display.